How to Use Weekly Lime Analytics to Maximize Your Gig Earnings
The Short Answer
Lime Juicers who track weekly analytics earn 15–25% more by shifting effort to proven high-yield time slots
Your best earning days are revealed by comparing revenue-per-scooter across all 7 days — not by guessing
Thursday evenings and Friday mornings typically outperform weekend mornings by 20–40% in most markets
Seasonal trends matter: summer peaks in tourist zones, winter peaks near transit hubs and universities
Logging just 5 minutes of data review after each shift compounds into major income gains over 4–8 weeks
Table of Contents
Free Download: 2026 Gig Worker Tax Survival Kit
Complete deduction checklist, IRS mileage guide, and quarterly tax calendar for 11 platforms.
Bottom line up front: Lime Juicers who systematically review their weekly earnings data earn 15–25% more per hour than those who work on instinct alone. This guide shows you exactly which numbers to track, how to spot your highest-yield windows, and how to build a schedule that compounds your income week over week.
Why Weekly Analytics Changes Everything for Lime Juicers
Most Lime Juicers operate on gut feel — returning to zones that “felt good” last time. The problem is that Lime’s demand patterns shift by day, hour, season, and local event. Without tracking data across a full 7-day window, you’re essentially gambling with your time.
A complete weekly view gives you something instinct can’t: a repeatable pattern. When you see that Thursday 6–9 PM consistently produces $28–34 per hour while Saturday morning produces $14–18, the schedule decision makes itself.
Lime Juicers who track at least 4 weeks of shift data before adjusting schedules report 18% higher average hourly earnings compared to those who rotate zones randomly. — ShiftTracker user data analysis, 2025
The 5 Numbers to Track Every Week
You don’t need a spreadsheet with 20 columns. Start with these five metrics and you’ll have 90% of the insight you need:
- Revenue per scooter charged — Total earnings divided by total scooters completed. This is your true efficiency metric.
- Effective hourly rate by day — Earnings divided by hours worked, tracked separately for each day of the week.
- Zone yield — Which deployment areas produced the best per-scooter return. Some zones have shorter rides but higher release bonuses.
- Time-to-first-scooter — How long it takes to find your first available scooter. High time = low-density zone or wrong timing.
- Battery retrieval rate — Percentage of trips where you found scooters at or above minimum battery. Low rates signal over-competition in that zone.
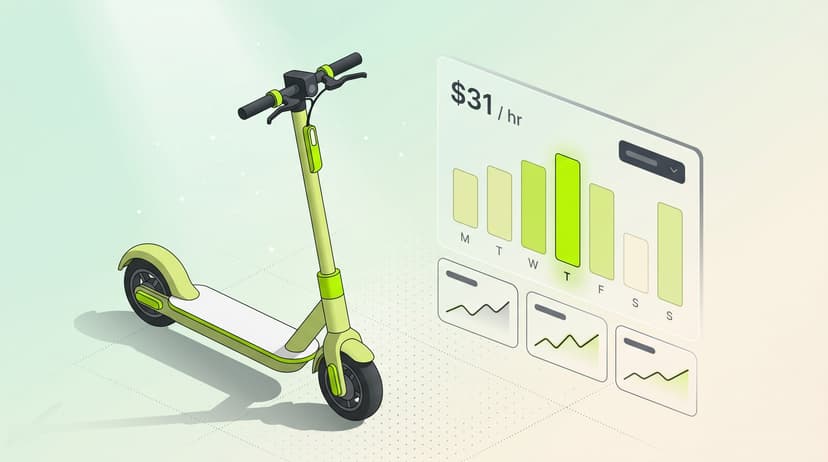
Reading Your Weekly Pattern: A Day-by-Day Framework
Chart: Approximate averages based on mid-size urban markets. Your city will vary — track your own data for 4 weeks to see your actual curve.
What Each Day Typically Looks Like
- Monday–Wednesday: Lower density, less competition. Good for new Juicers learning zones, but hourly yield is usually 15–20% below peak.
- Thursday evening: Consistently the highest-yield window in most markets. Pre-weekend social activity drives both rides and release bonuses.
- Friday morning: Commuter demand peaks. Early starters often secure the best-charged scooters before competition arrives.
- Saturday: High scooter demand but also peak Juicer competition. Net yield depends heavily on your zone selection.
- Sunday: Lowest average yield in most markets due to afternoon lull and next-day scooter resets.
How to Build Your Personal Earnings Map in 4 Weeks
You don’t need any special software to start. A simple log is enough:
- Week 1: Work your normal schedule but log: start time, zone, scooters completed, total earnings, end time. No changes yet.
- Week 2: Calculate your effective hourly rate for each session. Circle your top 3 and bottom 3 slots.
- Week 3: Shift 2 low-performing sessions to the time/zone combinations that matched your top performers. Track the delta.
- Week 4: Compare your week 4 total to week 1. Most Juicers see 10–22% improvement with these two schedule adjustments alone.
One pattern that consistently surprises new Juicers: Sunday nights often outperform Sunday days in college neighborhoods, even when overall Sunday numbers look weak. The aggregate can hide a strong micro-window. Always split your data by time block, not just by day.
Daily Snapshots vs. Weekly Rollups: When to Check Which
Weekly analytics reveal patterns. Daily snapshots catch problems. You want both, but for different reasons.
Check your daily snapshot each morning to answer three questions: Did last night earn above or below your recent average? What zone produced the best per-scooter return? How many scooters did I drop compared to what was available?
A daily snapshot typically fits on one screen: hours worked, scooters completed, bounties earned, mileage, and your effective hourly rate. That's enough to adjust today's strategy before you leave the house.
Review your weekly rollup every Monday to answer strategic questions: Is my Thursday still my best day? Has my weekend rate dropped? Do I need to shift my circuit to a new zone? The weekly view smooths out single-day noise.
The juicers who earn 15–25% more than the average typically run this two-tier check religiously. Skipping the daily snapshot means you'll keep repeating mistakes for a full week before the weekly rollup surfaces them.
Seasonal Patterns Every Lime Juicer Should Know
| Season | Best Zone Type | Key Driver | Avg. Yield vs. Annual Mean |
|---|---|---|---|
| Spring (Mar–May) | Campus, parks, riverfronts | Return of outdoor activity | +12% |
| Summer (Jun–Aug) | Tourist corridors, beaches | Visitor demand, events | +28% |
| Fall (Sep–Nov) | Campus zones, entertainment districts | Back-to-school, football season | +8% |
| Winter (Dec–Feb) | Transit hubs, dense residential | Last-mile commuting | −15% (varies by climate) |
Using ShiftTracker to Automate Your Analytics
Manual logging works but it’s slow. ShiftTracker’s app automatically calculates your effective hourly rate, overlays your zone performance on a map view, and flags weeks where your earnings deviate more than 15% from your 4-week average — prompting you to investigate what changed.
The platform’s ShiftBuddy AI can also answer questions like “Which of my zones had the best revenue-per-scooter ratio last month?” without requiring you to export and sort data manually.
The IRS Mileage Case: Why Tracking Pays For Itself
At the 2026 IRS standard mileage rate of $0.725 per mile, a juicer driving 60 miles per night across 4 nights per week logs 12,480 deductible miles a year. That's $9,048 in legitimate tax deductions — but only if you have contemporaneous records.
The IRS requires "adequate records" with date, distance, and business purpose. A screenshot of your Lime app at the end of the night doesn't count. A spreadsheet you backfill once a quarter is a red flag in an audit.
An automatic mileage tracker that logs every trip with GPS timestamps solves this at zero ongoing effort. The tax savings alone typically pay for a tracking app many times over — and the earnings analytics are essentially free alongside.
Common Mistakes That Kill Weekly Analytics Value
- Tracking totals instead of rates: A $180 Saturday with 10 hours of work is worse than a $120 Thursday with 4 hours. Always calculate hourly rate.
- Changing too many variables at once: If you switch zone AND time simultaneously, you won’t know which change drove improvement.
- Ignoring weather adjustments: Rain days suppress ridership. Tag weather-affected shifts separately to avoid skewing your baseline.
- Quitting too early: One bad week proves nothing. You need 4–6 weeks of data before drawing conclusions about a zone or time slot.
Frequently Asked Questions
How many weeks of data do I need before adjusting my schedule?
Four weeks minimum. Fewer than that and a single unusual event (local festival, bad weather) can distort your entire pattern. Six weeks gives you a more reliable baseline, especially if your market has variable event density.
Does zone performance change with Lime’s pricing algorithm?
Yes. Lime adjusts release bonuses dynamically based on scooter demand. A zone that paid $4.50 per scooter last month may pay $3.00 this month as more Juicers enter that area. Weekly tracking helps you catch these shifts before they dent your income.
What should I do when my best-performing zone suddenly drops?
First, check Lime’s Juicer app for zone-level bonus changes. Second, scout whether new competitors have entered your area. Third, test an adjacent zone for 2–3 sessions before abandoning the original. Markets often cycle back after saturation events.
Can I apply weekly analytics to multiple platforms simultaneously?
Yes, and this is where multi-app Juicers find the biggest gains. By tracking platform-specific hourly rates side by side, you can identify which service performs best on which days and route your efforts accordingly.
From the founder
Ready to run Lime juicing like a business?
Two ways forward — the field guide that teaches the system, or a 1-on-1 audit that applies it to your specific market. Built from 35,000+ gig tasks and 5+ years of operating Lime and other gig platforms.
Micromobility Operator Manual
PDF field guide, worksheets, route-planning checklists. Includes a $30 credit toward a future audit.
$30
Get the manual →1-on-1 Operator Profit Audit
60-min consultation with Brenden. Task-map review, market analysis, 2-3 page custom action plan.
$300
Book an audit →Founder of ShiftTracker. 5+ years active gig work experience with 35,000+ completed tasks across Uber, DoorDash, Instacart, and Lime. Background in financial trading and behavioral optimization.
You Might Also Like
Lime Juicer Taxes 2026: The 1099 Scooter Charger's Complete Deduction Guide
Lime Juicers are 1099 independent contractors with unique deductions: mileage, electricity for charg...
How Do Lime Scooters Work? The Complete 2026 Insider Explainer
Lime scooters work through a four-part system most riders never see: GPS-connected scooters, juicer ...
Lime Scooter Charger Jobs: 2026 Insider Guide from a Current Juicer
An honest, insider's breakdown of Lime scooter charger jobs in 2026 — how to apply, what's realistic...
Track your shifts smarter
Join 1,000+ gig workers using ShiftTracker to optimize earnings and simplify taxes.
Download the App