2026 Gig Economy Statistics & Data
By Brenden Warn, Founder & Gig Economy Analyst
The most comprehensive collection of gig economy data for 2026. Market size, platform earnings, driver demographics, tax data, and trends — all sourced and updated monthly.
If you cite this data, please link back to this page. Licensed under CC BY 4.0.
73M
US gig workers
$455B
US gig economy market
67%
DoorDash market share
$0.725
IRS mileage rate/mile
How Big Is the Gig Economy in 2026?
| Metric | 2024 | 2025 | 2026 (est.) | Source |
|---|---|---|---|---|
| US gig economy market size | $370B | $412B | $455B | Mastercard/Intuit |
| US gig workers | 64M | 68M | 73M | McKinsey/BLS |
| % of US workforce | 38% | 42% | 45% | Upwork/BLS |
| US food delivery market | $66B | $71B | $76B | Statista/Edison |
| US grocery delivery market | $31B | $35B | $39B | eMarketer |
What Is Each Platform's Market Share?
| Platform | US Market Share | Category | Source |
|---|---|---|---|
| DoorDash | 67% | Food Delivery | Bloomberg Second Measure |
| Uber Eats | 23% | Food Delivery | Bloomberg Second Measure |
| Grubhub | 6% | Food Delivery | Bloomberg Second Measure |
| Instacart | ~45% | Grocery Delivery | YipitData |
| Walmart Spark | Growing | Grocery Delivery | Walmart Q4 2025 Earnings |
| Uber (rideshare) | ~72% | Rideshare | Statista |
| Lyft | ~28% | Rideshare | Statista |
Market share figures are approximate and based on transaction volume data. See individual sources for methodology.
How Much Do Gig Workers Earn Per Hour in 2026?
| Platform | Avg Net $/hr | Peak Window $/hr | Best For |
|---|---|---|---|
| DoorDash | $13-$20 | $22-$28 | Flexible schedule, highest volume |
| Uber Eats | $13-$19 | $24-$30 | Urban markets, tip transparency |
| Instacart | $18-$26 | $25-$32 | High-income suburbs, weekends |
| Walmart Spark | $15-$22 | $25-$30 | Suburbs, weekday lunch |
| Lyft | $14-$22 | $25-$35 | Major metros, surge hunting |
| Grubhub | $13-$19 | $22-$26 | Campus/hospital contracts |
| Medical Courier | $24-$32 | $30-$40 | Highest paying, background check |
| Amazon Flex | $22-$28 | $25-$32 | Predictable block pay |
Net hourly pay = gross earnings minus gas (~$0.15/mi), maintenance (~$0.08/mi), and vehicle depreciation. Does not include tax liability. Sources: Gridwise 2026 Driver Earnings Report, ShiftTracker user data analysis. Use our 1099 Tax Calculator to see after-tax pay.
What Are the Key Tax Numbers for Gig Workers in 2026?
| Tax Metric | 2026 Value | Source |
|---|---|---|
| IRS standard mileage rate | $0.725/mile | IRS.gov |
| Self-employment tax rate | 15.3% | IRS (12.4% SS + 2.9% Medicare) |
| Standard deduction (Single) | $14,600 | IRS Rev. Proc. |
| Avg miles driven by full-time gig worker | 25,000-35,000/yr | ShiftTracker analysis |
| Avg annual mileage deduction | $18,125-$25,375 | Calculated at $0.725/mi |
| % of drivers who undertrack mileage | 43% | ShiftTracker user data |
| Avg tax overpayment from missed deductions | $1,595-$2,393/yr | Calculated at 22% bracket |
| Quarterly tax payment deadlines | Apr 15, Jun 15, Sep 15, Jan 15 | IRS |
Full mileage deduction breakdown: 2026 IRS Mileage Rate Guide. Calculate your personal tax liability: Free 1099 Tax Calculator.
When Do Gig Workers Earn the Most?
| Window | Pay Premium | Best Platform |
|---|---|---|
| Friday/Saturday 5pm-9pm | +40-60% | DoorDash + Uber Eats |
| Weekday 10am-2pm | +30-50% | Walmart Spark |
| Saturday 11am-3pm | +35-55% | Instacart + Spark |
| Fri/Sat 10pm-1am | +25-45% | DoorDash late-night |
| Bad weather events | +100-200% | All platforms |
| Monday dinner | -30-40% | Worst window |
Pay premium is relative to average hourly rate for that platform. Source: ShiftTracker user data, Gridwise driver analytics. Full breakdown: Best Times to DoorDash | Best Times for Walmart Spark.
Does Multi-Apping Actually Increase Earnings?
Single app (DoorDash only)
$13-$20/hr
Single app (Uber Eats only)
$13-$19/hr
DoorDash + Uber Eats together
$22-$28/hr
Multi-apping increases effective hourly rate by 30-50% during peak windows by eliminating idle time between orders.
Source: Gridwise 2026 report, ShiftTracker user data. Rule: only accept second order if pickup is within 0.5 miles.
Who Are Gig Workers in 2026?
Work Status
Source: Pew Research Center, MBO Partners 2025 report
Age Distribution
Source: Intuit QuickBooks Self-Employed survey 2025
Track Your Own Gig Economy Data
ShiftTracker automatically logs shifts, mileage, and earnings across all platforms. See your real numbers — not averages.
Want the full tax checklist for gig workers?
Download our free 10-page Tax Survival Kit with deduction checklists for 11 platforms.
Get Free PDFFrequently Asked Questions
How big is the gig economy in 2026?
The US gig economy is estimated at $455 billion in 2026, with approximately 73 million Americans participating in some form of gig work — about 45% of the US workforce. Food delivery alone represents a $75+ billion market.
How much do gig workers make in 2026?
Average net hourly pay ranges from $13-$20/hr for food delivery (DoorDash, Uber Eats) to $18-$26/hr for grocery delivery (Instacart) and $22-$32/hr for medical courier work. Net pay accounts for gas, mileage, and vehicle expenses but not taxes.
What is the IRS mileage rate for 2026?
The 2026 IRS standard mileage rate is $0.725 per mile for business use. A full-time gig worker logging 20,000 business miles claims a $14,500 deduction, saving approximately $3,190 in federal taxes at a 22% bracket.
Which gig app has the most market share?
DoorDash leads US food delivery with approximately 67% market share, followed by Uber Eats at 23% and Grubhub at 6%. In grocery delivery, Instacart is the market leader, with Walmart Spark growing rapidly in suburban markets.
Cite this page
Warn, B. (2026). 2026 Gig Economy Statistics & Data. ShiftTracker. https://shifttrackerapp.com/research/gig-economy-statistics-2026
Last updated: April 2026. This page is updated monthly with the latest available data. Licensed under CC BY 4.0 — you may share and adapt with attribution.
Related from the Blog
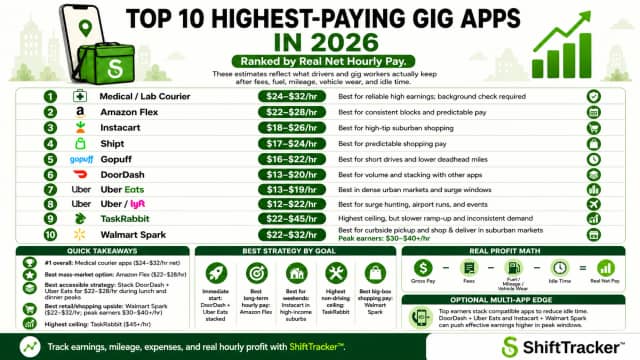
10 Highest-Paying Gig Apps in 2026 (Best for Same-Day Pay & Always-Hiring Platforms)
Medical courier apps, Amazon Flex, and Instacart lead the 2026 rankings for highest net hourly pay. DoorDash and Uber Eats rank 6th and 7th for solo drivers - but jump to $22+/hr when stacked together. See the full ranked list.

12 Best Gig Worker Apps Always Hiring in 2026 (Same-Day Pay + Real Earnings Ranked)
See the best gig worker apps for 2026 — automate mileage, track expenses, use earnings analytics, and apply AI tips to raise pay and simplify taxes.

How Much Do Food Delivery Drivers Make in 2026? ($37K-$52K Gross, $26K-$39K Net)
Full-time food delivery driver earnings in 2026: real weekly pay for 20, 40, and 60 hours. Includes expenses, taxes, and tips to maximize take-home pay.